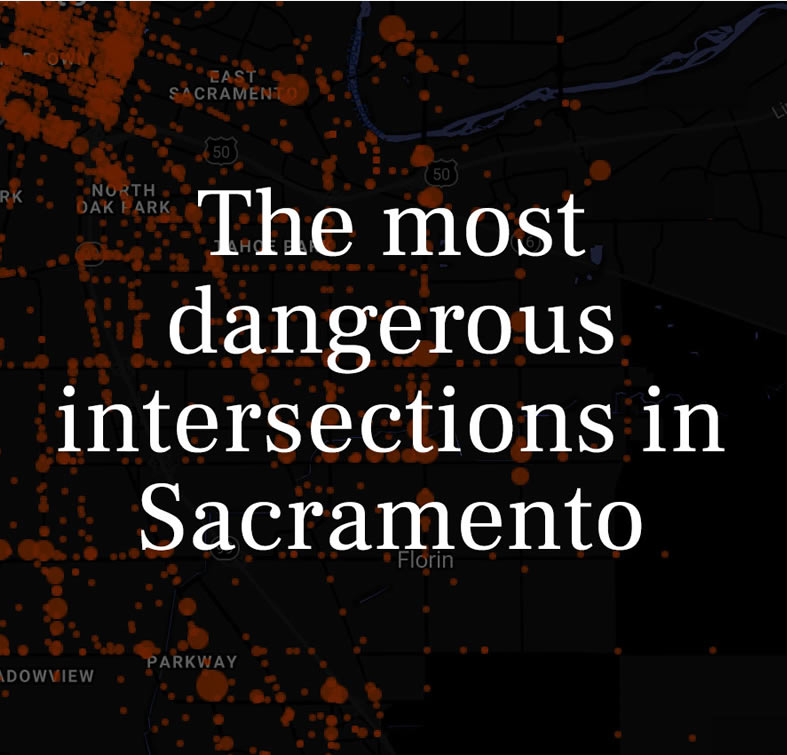
New Study: The Most Dangerous Intersections in Sacramento
From 2013-2017, there were over 26,000 motor vehicle crashes in the city of Sacramento. Of these crashes, 5,517 occurred at intersections.
Considering motor vehicle accidents in Sacramento are the majority of the cases our law firm handles, we wanted to conduct an analysis to which of the city’s intersections pose the highest risk to drivers.
Where do collisions occur more frequently? What intersections are the most dangerous in Sacramento?
We worked with data visualization company 1point21 Interactive and analyzed five years of traffic collision data from the California Highway Patrol to find out. Below are the results of our study.
Interactive Map of Crashes at Intersections
Through our analysis, we found that while intersection-related accidents make up just over 20 percent of total crashes in Sacramento, they cause more than 33 percent of total injuries and 30 percent of all severe injuries.
From 2013-2017, there were over 5,500 crashes at Sacramento intersections, leading to 6,695 injuries (including 262 severe injuries) and 46 fatalities.
The interactive map below shows where all intersection-related crashes occurred in Sacramento during the study period.
Larger circles indicate a higher Danger Index score, which is scored based on the total number of crashes and the severity of injuries at that intersection.
*Note: You can zoom in on the map and click any red circle for additional information. Drag and drop the yellow person icon to switch to a street view of that location.
Dataset: The Most Dangerous Intersections in Sacramento
The table below shows all intersections in the city of Sacramento with a Danger Index of 50 or more. It includes the following information:
- Crashes: Total number of crashes at this street pair
- Injured: Total number of reported injuries
- MI: Minor Injuries
- VI: Visible Injuries
- SI: Serious Injuries
- Fatals: Number of total fatalities
- Danger Index: Total rating based on the number of crashes, the severity of injuries and number fatalities at that intersection. Rank is determined by the danger index.
| Rank | Intersection | Crashes | Injured | MI | VI | SI | Fatals | Danger Index |
|---|---|---|---|---|---|---|---|---|
| 1 | Arena Bl & Truxel Rd | 26 | 50 | 44 | 6 | 0 | 0 | 166 |
| 2 | Los Robles Bl & Marysville Bl | 23 | 30 | 21 | 7 | 2 | 0 | 125.5 |
| 3 | 12Th St & I St | 22 | 34 | 28 | 5 | 1 | 0 | 124.5 |
| 4 | Franklin Bl & Mack Rd | 20 | 28 | 19 | 8 | 1 | 0 | 115 |
| 5 | 56Th St & J St | 18 | 28 | 20 | 7 | 1 | 0 | 110.5 |
| 6 | 9Th St & X St | 21 | 26 | 17 | 9 | 0 | 0 | 108.5 |
| 7 | Gateway Park Bl & Truxel Rd | 14 | 22 | 15 | 3 | 4 | 0 | 96.5 |
| 8 | 19Th St & X St | 11 | 20 | 13 | 6 | 1 | 1 | 91 |
| 9 | Florin Rd & Freeport Bl | 14 | 22 | 16 | 4 | 2 | 0 | 89 |
| 10 | Fruitridge Rd & Power Inn Rd | 14 | 19 | 17 | 2 | 0 | 2 | 86.5 |
| 11 | Elder Creek Rd & Power Inn Rd | 16 | 24 | 20 | 4 | 0 | 0 | 86 |
| 12 | Bruceville Rd & Cosumnes River Bl | 16 | 21 | 16 | 4 | 1 | 0 | 83.5 |
| 13 | San Juan Rd & Truxel Rd | 11 | 20 | 15 | 1 | 4 | 0 | 83.5 |
| 14 | Auburn Bl & Rt 244 | 5 | 7 | 2 | 2 | 3 | 4 | 82.5 |
| 15 | Broadway & Riverside Bl | 14 | 19 | 15 | 4 | 0 | 1 | 81.5 |
| 16 | El Camino Av & Rio Linda Bl | 10 | 16 | 8 | 5 | 3 | 0 | 77.5 |
| 17 | Fair Oaks Bl & Howe Av | 14 | 17 | 14 | 2 | 1 | 1 | 76.5 |
| 18 | Brookfield Dr & Franklin Bl | 10 | 21 | 16 | 5 | 0 | 0 | 75 |
| 19 | 24Th St & X St | 15 | 19 | 15 | 3 | 1 | 0 | 75 |
| 20 | Garden Hwy & Northgate Bl | 16 | 15 | 10 | 2 | 3 | 0 | 73.5 |
| 21 | 43Rd Av & Rt 5 | 13 | 19 | 14 | 5 | 0 | 0 | 73 |
| 22 | 29Th St & L St | 13 | 18 | 12 | 6 | 0 | 0 | 73 |
| 23 | Truxel Rd & West El Camino Av | 11 | 16 | 9 | 6 | 1 | 0 | 71 |
| 24 | Marysville Bl & North Av | 9 | 18 | 13 | 4 | 1 | 0 | 69 |
| 25 | Auburn Bl & Watt Av | 9 | 13 | 8 | 3 | 2 | 1 | 69 |
| 26 | 26Th St & X St | 12 | 17 | 12 | 5 | 0 | 0 | 67 |
| 27 | Grand Av & Taylor St | 7 | 18 | 12 | 6 | 0 | 0 | 67 |
| 28 | Arcade Bl & Marysville Bl | 13 | 19 | 17 | 2 | 0 | 0 | 65.5 |
| 29 | 5Th St & P St | 7 | 14 | 7 | 5 | 2 | 0 | 64.5 |
| 30 | 5Th St & J St | 14 | 19 | 18 | 1 | 0 | 0 | 64 |
| 31 | Fruitridge Rd & Stockton Bl | 14 | 16 | 13 | 2 | 1 | 0 | 64 |
| 32 | 30Th St & E St | 13 | 19 | 18 | 1 | 0 | 0 | 63 |
| 33 | 21St St & Broadway | 10 | 17 | 13 | 4 | 0 | 0 | 62.5 |
| 34 | Grand Av & Rio Linda Bl | 10 | 17 | 13 | 4 | 0 | 0 | 62.5 |
| 35 | College Town Dr & Howe Av | 12 | 17 | 14 | 3 | 0 | 0 | 62 |
| 36 | Folsom Bl & Watt Av | 9 | 19 | 17 | 2 | 0 | 0 | 61.5 |
| 37 | 8Th St & W St | 9 | 17 | 14 | 2 | 1 | 0 | 61.5 |
| 38 | Albatross Wy & El Camino Av | 9 | 17 | 13 | 4 | 0 | 0 | 61.5 |
| 39 | Bicentennial Cir & Folsom Bl | 9 | 15 | 10 | 4 | 1 | 0 | 61.5 |
| 40 | 16Th St & D St | 11 | 18 | 16 | 2 | 0 | 0 | 61 |
| 41 | 28Th St & L St | 8 | 12 | 5 | 5 | 2 | 0 | 60.5 |
| 42 | 24Th St & 69Th Av | 7 | 17 | 13 | 4 | 0 | 0 | 59.5 |
| 43 | Del Paso Bl & Eleanor Av | 7 | 17 | 13 | 4 | 0 | 0 | 59.5 |
| 44 | Auburn Bl & Connie Dr | 9 | 18 | 16 | 2 | 0 | 0 | 59 |
| 45 | North 16Th St & Richards Bl | 9 | 17 | 14 | 3 | 0 | 0 | 59 |
| 46 | Del Paso Bl & Helena Av | 9 | 11 | 8 | 1 | 2 | 1 | 59 |
| 47 | Florin Rd & Greenhaven Dr | 11 | 14 | 9 | 5 | 0 | 0 | 58.5 |
| 48 | 16Th St & J St | 11 | 11 | 4 | 6 | 1 | 0 | 58.5 |
| 49 | Ford Rd & Norwood Av | 8 | 18 | 16 | 2 | 0 | 0 | 58 |
| 50 | 24Th Av & Florin Perkins Rd | 10 | 18 | 17 | 1 | 0 | 0 | 57.5 |
| 51 | 24Th St & Florin Rd | 15 | 16 | 15 | 1 | 0 | 0 | 57.5 |
| 52 | Manorside Dr & Meadowview Rd | 7 | 15 | 10 | 5 | 0 | 0 | 57 |
| 53 | Mack Rd & Valley Hi Dr | 9 | 17 | 15 | 2 | 0 | 0 | 56.5 |
| 54 | Natomas Crossing Dr & Truxel Rd | 9 | 16 | 13 | 3 | 0 | 0 | 56.5 |
| 55 | Grand Av & Norwood Av | 9 | 13 | 8 | 4 | 1 | 0 | 56.5 |
| 56 | Florin Rd & Tamoshanter Wy | 11 | 17 | 16 | 1 | 0 | 0 | 56 |
| 57 | Elder Creek Rd & Florin Perkins Rd | 6 | 11 | 7 | 3 | 1 | 1 | 56 |
| 58 | 15Th St & W St | 13 | 13 | 9 | 4 | 0 | 0 | 55.5 |
| 59 | 29Th St & K St | 13 | 13 | 9 | 4 | 0 | 0 | 55.5 |
| 60 | 16Th St & C St | 12 | 12 | 9 | 1 | 2 | 0 | 54.5 |
| 61 | 12Th St & G St | 11 | 13 | 9 | 4 | 0 | 0 | 53.5 |
| 62 | 21St St & Florin Rd | 6 | 14 | 11 | 1 | 2 | 0 | 53.5 |
| 63 | Arden Garden Connector & Northgate Bl | 6 | 10 | 4 | 3 | 3 | 0 | 53.5 |
| 64 | North 12Th St & Richards Bl | 13 | 13 | 10 | 3 | 0 | 0 | 53 |
| 65 | Bell Av & Rio Linda Bl | 10 | 14 | 11 | 3 | 0 | 0 | 52.5 |
| 66 | Freeport Bl & Meadowview Rd | 5 | 11 | 8 | 2 | 1 | 1 | 52.5 |
| 67 | 29Th St & Q St | 12 | 12 | 8 | 4 | 0 | 0 | 52 |
| 68 | 16Th St & Q St | 9 | 13 | 10 | 2 | 1 | 0 | 51.5 |
| 69 | Richards Bl & Sunbeam Av | 9 | 13 | 10 | 2 | 1 | 0 | 51.5 |
| 70 | Brookfield Dr & Meadowview Rd | 9 | 13 | 9 | 4 | 0 | 0 | 51.5 |
| 71 | Marysville Bl & Rio Linda Bl | 9 | 11 | 6 | 4 | 1 | 0 | 51.5 |
| 72 | 7Th St & I St | 4 | 12 | 7 | 3 | 2 | 0 | 51.5 |
| 73 | 29Th St & T St | 11 | 15 | 14 | 1 | 0 | 0 | 51 |
| 74 | 19Th St & K St | 11 | 12 | 8 | 4 | 0 | 0 | 51 |
| 75 | 12Th St & J St | 8 | 14 | 11 | 3 | 0 | 0 | 50.5 |
| 76 | Amherst St & Meadowview Rd | 8 | 14 | 11 | 3 | 0 | 0 | 50.5 |
| 77 | Center Pkwy & Cosumnes River Bl | 8 | 11 | 9 | 2 | 0 | 1 | 50.5 |
| 78 | 26Th St & P St | 8 | 10 | 5 | 3 | 2 | 0 | 50.5 |
| 79 | Amherst St & Florin Rd | 10 | 11 | 7 | 3 | 1 | 0 | 50 |
Nearly 17 percent of all intersection crashes (884 of 5,517 crashes) occurred at one of these 79 crossings. They combined for 1,333 total injuries (including 60 severe injuries) and 14 fatalities.
The Top 25: By Danger Index Score
While our full study identified 79 intersections with a Danger Index score of 50 or higher, the top twenty-five on our list scored as significantly more dangerous. These crossings had an average score of 90.5, more than 30 points higher than the fifty-four that they precede.
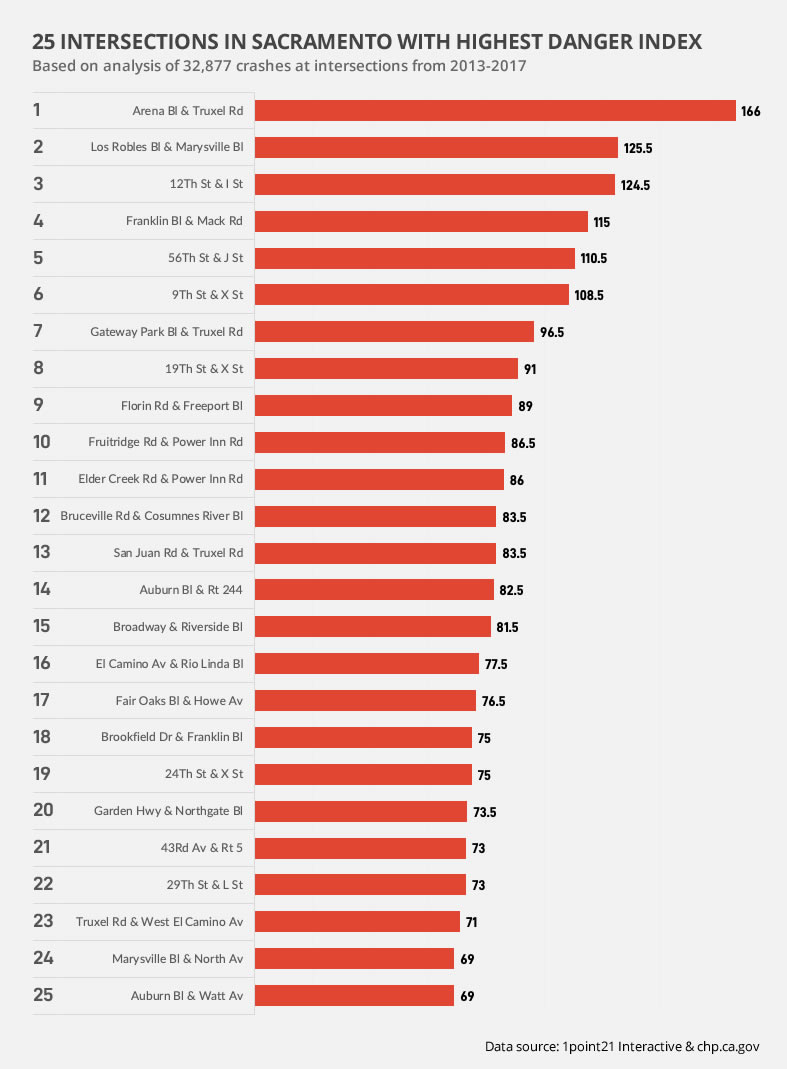
The Most Dangerous Intersection in Sacramento: Arena Blvd & Truxel Rd
We identified Arena Blvd and Truxel Road as the most dangerous intersection in Sacramento. Located in the Natomas area of Sacramento, Arena Blvd and Truxel Road led the way in total crashes (26), total injuries (50), and Danger Index (166).
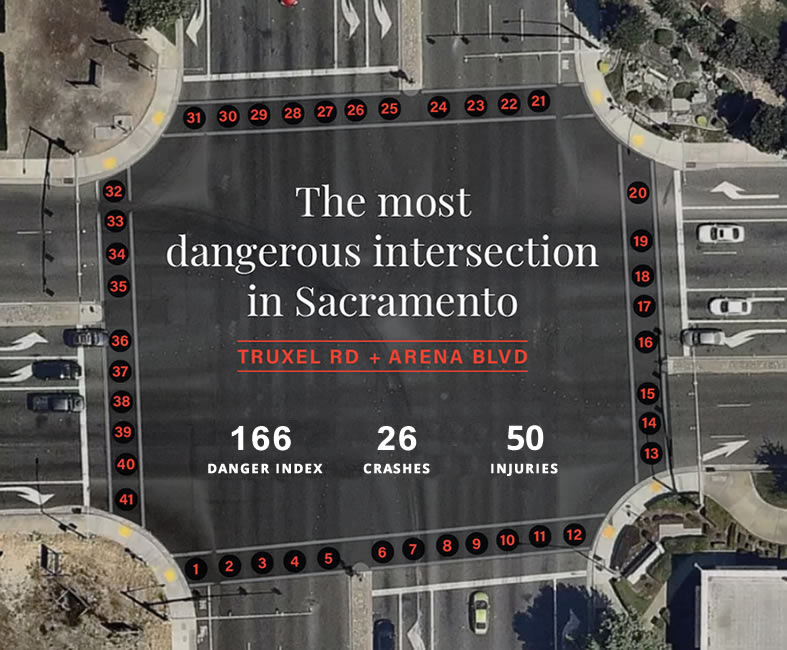
Whether its due to the proximity to Sleep Train Arena, the Airport, or simply the amount of traffic going through one of the intersection’s 41 lanes of traffic(!), more collisions and injuries occur at Arena and Truxel than at any other intersection in Sacramento.
Methodology and Data:
This study identifies dangerous intersections in Sacramento based on crash volume and injury severity.
Our data comes from the Statewide Integrated Traffic Records System maintained by the California Highway Patrol for the years 2013 – 2017. We included only crashes that occurred at intersections and removed any that occurred major highway crossings or highway on or off ramps. If you’ve been injured in an accident, reach out to a car accident attorney now.